Smaller companies, bigger prices – and what that means
You’ve heard of shrinkflation in consumer products like chocolate bars, drinks and even toilet paper: smaller portions at the same or higher cost. Have you ever considered that the same might be happening with companies being backed by private equity, albeit for different reasons? We’ve had a hunch for a while that our mid-market clients seem to be backing smaller organisations at higher valuations so we thought we would test it using the Catalysis project database.
Taking 451 previous exercises where we have all the necessary data (from 655 projects in total), and the companies were at least break even, we looked at headcount, revenue and EBITDA in three-year periods from 2010 on wards. These numbers were generally the most recent actual numbers, as opposed to forecasts. It became apparent that the data was too thin and unreliable for 2010-2012 so we have excluded that from the analysis. Those raw numbers could then be turned into ratios for revenue/head, EBITDA/head and EBITDA as a percentage of revenue. There are methodological issues we could debate, but (a) we’re doing this for fun not to prove anything and (b) the trends seem sufficiently large to remain true despite those issues.
Combining all investor categories we serve, it seems like the hunch is correct. As the table below shows, over the last decade, average headcount has roughly halved, revenue has dropped by about 40%, EBITDA by less. revenue/head has crept up a little, but EBITDA/head has almost doubled, reflected also in EBITDA margins similarly almost doubling.
You may wonder, though, could this be caused by changes in the Catalysis client mix? Are we just working with smaller ticket investors. The short answer is no: in terms of numbers of projects over time, that mix has been surprisingly stable in terms of typical equity ticket sizes, with about 40% of our work carried out for small cap investors (typically investing £2 – 10 Mn.), 45% for lower mid-market (£10 – 30 Mn.) and the remainder mid mid-market (£30 – 60Mn.). But to dig a bit deeper, we sliced the data between those three categories which was revealing.
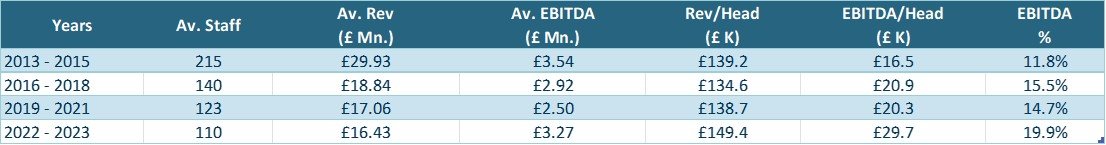
For lower mid-market clients, the trend described above remains very evident: staff numbers and revenues getting smaller, EBITDA mixed but possibly growing. Revenue/head roughly stable but EBITDA/head and EBITDA margins growing strongly.

Mid mid-market figures are thinner, and so less reliable, but seem to roughly follow a similar pattern, with staff numbers declining and EBITDA figures growing.
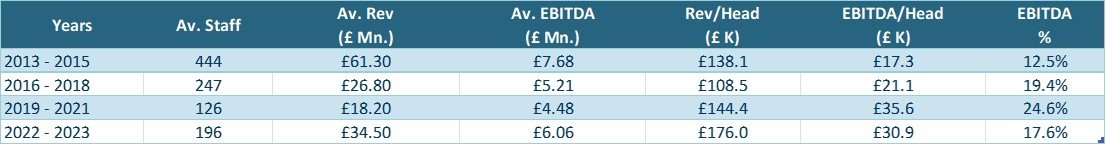
The apparent exception to this trend lies with the smaller cap funds. Staff numbers, revenue, and EBITDA all seem to grow not shrink, and the various ratios don’t grow. It is difficult to know, however, whether this might be due to the exclusion of loss-making businesses from this analysis especially in recent years where the boundaries between classic private equity businesses (only backing profitable businesses) and venture capital (funding losses, trying to value assets on multiples of revenue) has blurred.

So what does this mean for investors?
From a team and organisation perspective, lower mid-market investors are having to take on scaling issues which previously would have been seen more frequently only by small cap investors. That implies more involvement from investors and Chairs, and more work on developmental roadmaps by people like us.
We think two main things:
It looks like the business models being backed by lower mid-market investors have been becoming more profitable. Add onto that the upward drift in valuation multiples over the last 20 years and prices for companies have inevitably risen. But the organisations in terms of headcount have shrunk. In one memorable case last year, one of our clients backed a business with £6 Mn. of EBITDA and headcount of fewer than 30 people. That really is productive.
Are you seeing this too?
Stay connected with news and updates!
Join our mailing list to receive the latest news and updates from our team.
Don't worry, your information will not be shared.